

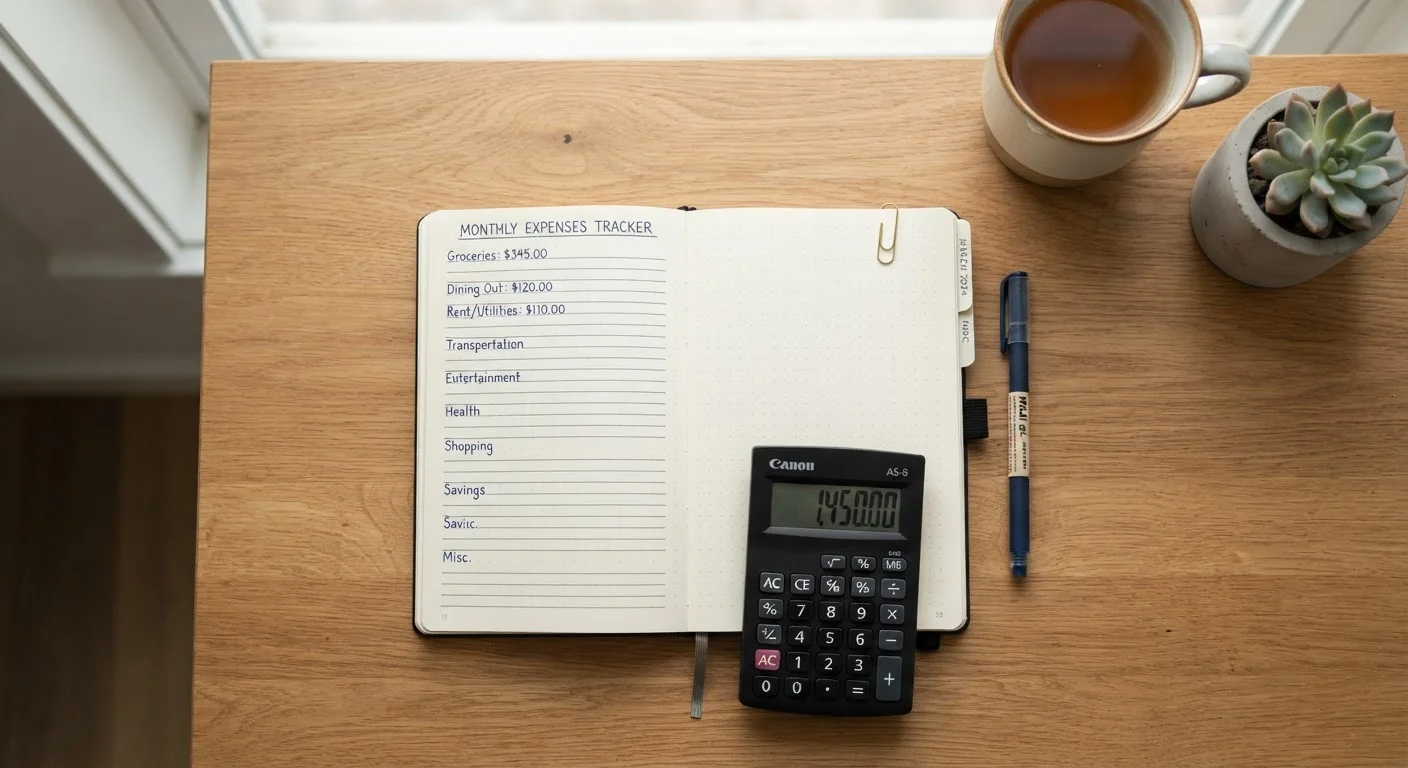
Why Most People Don't Know Where Their Money Goes
Most of us carry a rough sense of our spending - a mental sketch built from receipts we half-remember and transactions we scroll past in the banking app. That sketch is usually wrong, not because we're careless, but because human memory systematically underestimates small and frequent purchases while overestimating large, visible ones.
Tracking spending directly addresses this. It replaces estimation with evidence, and evidence is the only reliable starting point for any financial decision - whether that's reducing debt, saving for something specific, or simply feeling less anxious about money each month. Understanding your savings rate and debt-to-income ratio becomes possible only once you know what's actually flowing out.
This guide walks through a practical, low-tech process that works regardless of income level. No app subscription required.
What you will need
What You'll Need Before You Start
The tools for this are minimal. What matters most is having complete, accurate transaction data - not a particular app or format.
Bank or credit union statements
Provides a complete, accurate record of every transaction - the raw material for your spending review.
Spreadsheet (e.g. Google Sheets or Excel)
Allows you to categorise and subtotal transactions quickly without manual arithmetic.
Notebook and pen
A paper alternative for listing and grouping transactions if you prefer to work offline.
Highlighting pens or colour coding
Helps visually group spending categories when working from printed statements.
This Is Information, Not a Report Card
Spending data is neutral - it reflects choices made under real constraints, not a measure of your character or discipline. Approach the numbers with curiosity rather than judgement. The goal is clarity, not shame. If you find the process emotionally difficult, that's worth noting: it often points to beliefs about money worth examining, such as those explored in this reflective guide.
Step-by-Step: Tracking Your Spending
Follow these steps in order. The process takes around 30-45 minutes the first time. It gets faster with practice, and the insights compound once you start repeating it monthly.
Pull every transaction from the past 30 days
Log in to each bank account and credit card you use and export or print the last 30 days of transactions. Include everything: direct debits, card payments, cash withdrawals, and any automatic transfers. If you use multiple accounts, collect them all before moving on - gaps in the data will skew your picture.
Create a short list of spending categories
Before categorising individual transactions, decide on your categories. Keep it simple: aim for six to ten groupings that reflect how your money actually moves. Common categories include housing, food and groceries, transport, utilities, subscriptions, health, personal spending, and savings or debt repayments. Add categories that suit your life - pet costs, childcare, or hobby spending, for example - but resist splitting things too finely. You can always refine later.
Assign every transaction to a category
Work through your transaction list line by line and assign each one to a category. For a spreadsheet, add a category column beside each row. For paper, use colour-coding or write a category label next to each entry. Don't skip small amounts - recurring small purchases (coffee, convenience store stops, app purchases) often account for a surprising total when added up.
When a transaction covers more than one category - a supermarket shop that included cleaning products and clothing - assign it to the category that represents the majority of the spend. Perfect precision is less important than consistent, honest categorisation.
Total each category and calculate percentages
Add up the total spent in each category. Then divide each category total by your total outgoings for the month and multiply by 100 to get a percentage. This converts raw numbers into proportions, which are easier to reason about. For example, if you spent $3,200 in total and $960 went on housing, housing represents 30% of your spending.
Note your total outgoings alongside your net income for the period. If outgoings exceed income, that gap is the most important number on the page - and it's worth addressing directly, as covered in resources like our saving and debt guidance.
Identify the surprises and irregular costs
Look at your totals with fresh eyes. Most people find at least one or two categories where the actual number is significantly higher than their mental estimate. Common surprises include food delivery, online subscriptions, and small recurring purchases. Note these without over-reacting - one month of data is a data point, not a verdict.
Also list any annual or irregular costs you know are coming: insurance renewals, vehicle registration, professional memberships, holiday spending. Divide each by 12 to find the monthly equivalent, then add these as a separate line in your totals. This step alone closes a gap that catches many people off guard.
Decide on one or two things to adjust - not a total overhaul
With your category totals in front of you, choose one or two specific areas where you'd like spending to look different next month. Keep the scope narrow and realistic. A single conscious change - cancelling a subscription you forgot you had, or cooking at home an extra two nights a week - is more likely to stick than a sweeping spending freeze.
Write down the adjustment in plain terms: what you'll do differently, and approximately how much you expect it to save. This is the bridge between tracking and budgeting - a step explored further in our plain-language budgeting starting point.
Making the Information Work For You
A completed spending review is only useful if you act on it - even once, in a small way. The common mistake is to spend an hour categorising transactions, feel briefly virtuous, and then close the spreadsheet until guilt prompts the next review six months later.
The habit that actually changes behaviour is regular, short engagement with the numbers. Research on financial self-awareness consistently points to frequency over intensity: a 15-minute weekly glance at spending is more effective than an annual deep-dive. You can borrow from the same logic behind habit tracking more broadly - consistency and low friction matter more than comprehensiveness.
If this exercise reveals that spending consistently outpaces income, that's important information - not a crisis, but a clear signal to look at your overall financial structure. The first budget guide is a practical next step. For travel or major planned costs, the same tracking logic applies - see how it extends to estimating realistic trip costs before booking.
This article is for general informational and educational purposes only. It does not constitute personalised financial advice. For guidance tailored to your own financial situation, consult a qualified financial professional.